Transportation systems are some of the largest producers of greenhouse gas (GHG) emissions in the world. With most vehicles on the road still reliant on fossil fuels, tracking sustainability through transportation planning requires priority. For smaller planning organizations, such as campus shuttles and student-focused commuter routes, identifying sustainability levels can be difficult due to limited resources and knowledge.
Instead of starting my professional career right after graduating from UNH in 2021, I instead opted to enroll in a Master of Science program at UNH in Civil and Environmental Engineering, focusing on sustainability and transportation planning. I am currently finishing up this degree and intend on defending it at the end of the summer. Through conversation with other students and faculty, I became interested in public transportation and how well the system available on campus works, focusing on the balance of implementing sustainability practices while maintaining high user satisfaction. From this interest, I was able to create a case study to research the system further.
The purpose of my master’s thesis was to develop a tool for small transit organizations to quantify the sustainability of their fleet in a way that made it easy to understand, using simple inputs obtained from their annual records. To test this model, I investigated UNH’s own Wildcat Transit System through a case study approach. The final product resulted in a single, all-around sustainability score that the organization can use to track their progress, as well as offer justification in applying for funding that would increase this score further.
UNH Wildcat Transit
As one of the leading universities in campus sustainability, UNH takes pride in its efforts to adopt sustainable practices into many of its operations. This includes Wildcat Transit, a university/public bus transportation system that provides service to the UNH campus and surrounding towns. Wildcat transit services Durham, Portsmouth, and Dover NH, both as a commuting service for UNH students and faculty, and as a fare transit service to the general public. In accordance with sustainability initiatives at UNH, Wildcat Transit is proud of its diversified fleet, running vehicles fueled by diesel, natural gas and electricity. For my project, I focused on the vehicles fueled by diesel and natural gas (Compressed Natural Gas, or CNG) as their electric vehicles are not yet a part of their everyday use fleet.
Triple Bottom Line
The model is based around the Triple Bottom Line, a framework that focuses on quantifying impact based on environmental, social and economic factors. Sometimes referred to as the “People, Planet, Profit” approach, this method diversifies the analysis done on the subject to obtain more rounded results. Through the Triple Bottom Line, the intent is to calculate scores for each individual indicator category, and then add the scores up and apply a weight based on potential stakeholder priority placement among the three indicators. Methods for quantifying each indicator category are explained below.
Global Warming Potential
I chose to calculate Global Warming Potential (GWP) through GHG emissions from the production (manufacturing and travel to site) and usage (emission from fuel) phases (otherwise known as Well to Wheel, WTW) of the vehicles as an indicator to measure environmental impact. GWP is measured in kg-CO2 equivalent, a combination of all GHG emissions (carbon dioxide, methane, nitrous oxide, etc.) converted to a single unit for simplicity. Because the two types of vehicles that were analyzed were assumed to differ only by fuel type (diesel and CNG), looking at the differences in emissions was an effective way to measure differences in impact. Smaller levels of GWP correlate with smaller amounts of emissions; a lower score indicates lower impact and higher sustainability. Organizations input average annual miles traveled and life span for a single vehicle into the spreadsheet model. These inputs help the model to calculate usage phase GWP, which is then added to an assumed production phase GWP (based on engine type). Once the model calculates GWP, it then normalizes the score against a distribution made up of results from similar studies across academic literature. This normalized score is placed on a 0-1 scale, with 0 being the best and 1 being the worst.
Life-Cycle Cost
To quantify economic impact, I chose to analyze the life-cycle cost of a single bus in the UNH fleet. Similar to how I chose to track environmental impact, the costs of a single vehicle are analyzed by WTW. This includes costs from initial capital (vehicle acquisition, infrastructure development, etc.) to annual costs (fuel, operation and maintenance). Depending on the fuel type (diesel or CNG), these costs might differ from vehicle to vehicle, providing the ability to compare the different fuel types. CNG vehicles are the newer technology compared to diesel vehicles, and because of this, costs tend to be more expensive with higher variance. Like how GWP was calculated, the model computes a total life-cycle cost for the subject vehicle. Smaller costs lead to smaller impact and higher sustainability. It is important to note that this score is based on the projected total cost of a single vehicle in the fleet and not on the operating budget of the organization. This score is also normalized against the distribution of previous studies and reported as a score between 0 and 1, with 0 being the best and 1 being the worst.
User-Based Survey
Quantifying social impact was done a little differently. Instead of building a distribution to compare results to, I thought the results would be more meaningful if an active userbase was surveyed on their opinions of the system. To do this, I created an anonymous survey through the Qualtrics platform and sent it through the graduate school to students who regularly use Wildcat Transit to commute. I chose to send the survey through the graduate school because there is a larger percentage of graduate students who do not live within walking distance to campus compared to undergraduate students. This means that surveying graduate students has the potential to offer more meaningful results.
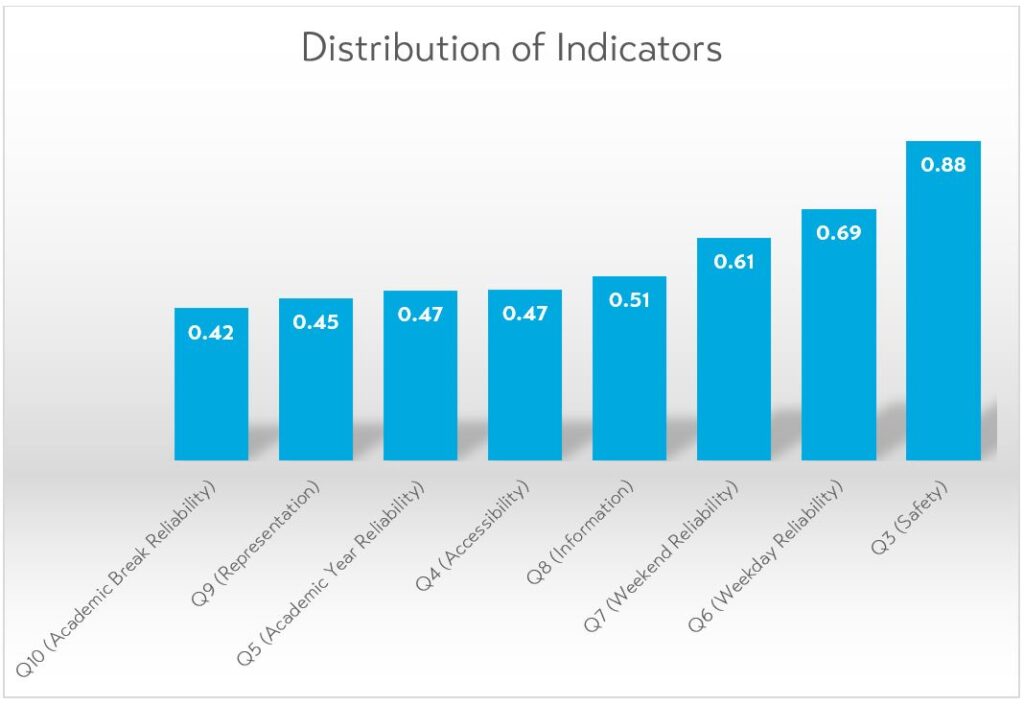
The students were asked questions relating to the systems’ reliability, if concerns expressed by the users were being heard, system safety, system accessibility, and if the users feel they are adequately informed about any changes in service. These questions were based on a scale of 1-10 with 10 being the best and 1 being the worst. To match the other two indicators, the results were calculated as 1 – the actual score. The scores from each variable were averaged together into a single social sustainability score. The unchanged results of the survey are presented in the figure below, ranked in order from lowest to highest score.
Stakeholder Profiles
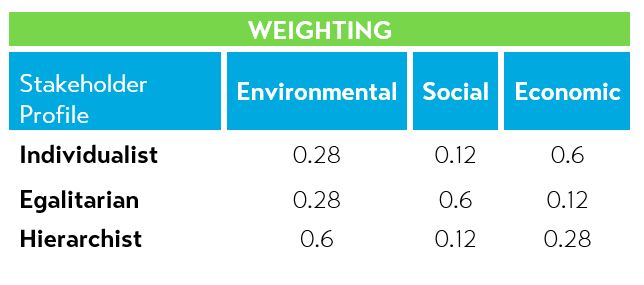
Once scores from each impact category were determined, they were added together to give an overall sustainability score. Once this total base score is calculated, I then applied weighting based on different stakeholder profiles taken from cultural theory of risk to assign priority among the three triple bottom line categories. These profiles are known as Hierarchist, Egalitarian, and Individualist. The table below shows the weighting applied to each impact category based on each of the stakeholder profiles.
Because scores are based on a 0-1 scale with 0 being the best and 1 being the worst, weighting based on stakeholder profile follows the same trend. Depending on which impact category is prioritized within each stakeholder profile (e.g., Egalitarian prioritizes social impact), that category would receive the lowest amount of weight (0.12). This keeps things consistent with my results.
If you would like to know more about cultural theory of risk, this article expands on it.
Results
Based on the input data obtained from Wildcat Transit and the results from the survey, the model shows that overall, the system already has high levels of sustainability from the economic and environmental indicators (Based on the 0-1 scale with 0 being the best).
The baseline results show initial priority to the economic score, indicating this system operates with smaller life-cycle vehicle costs than those within the distribution. While this baseline matches closely with the individual or hierarchist stakeholder profile, this model gives Wildcat Transit the ability to view results from a different perspective. In the figures below, the baseline score distribution is shown as well as the distributions for each of the differing stakeholder profiles.
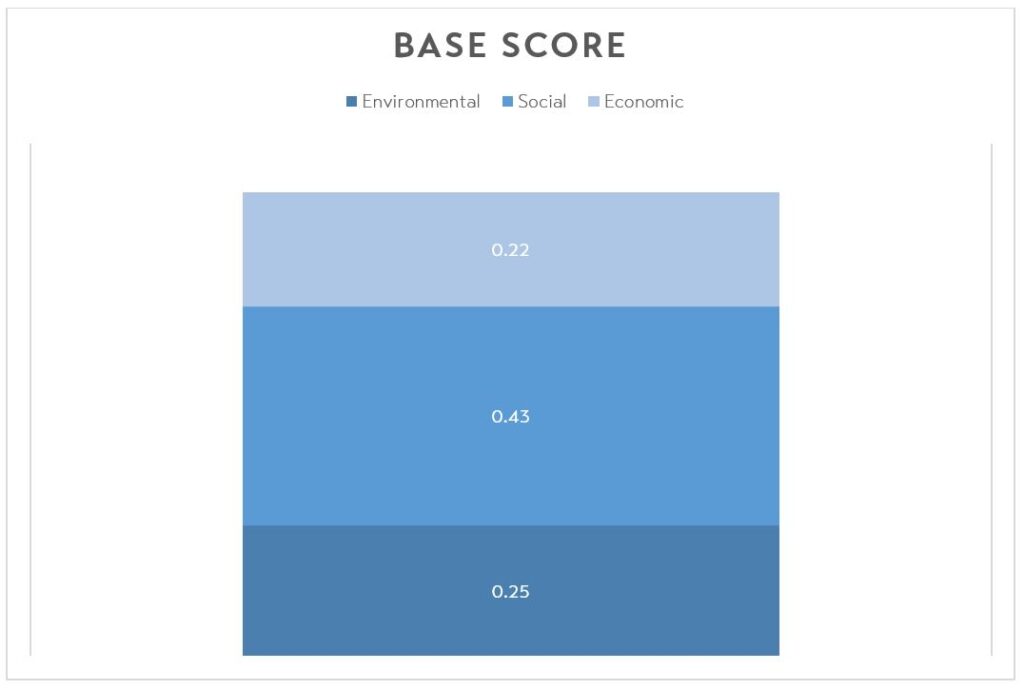
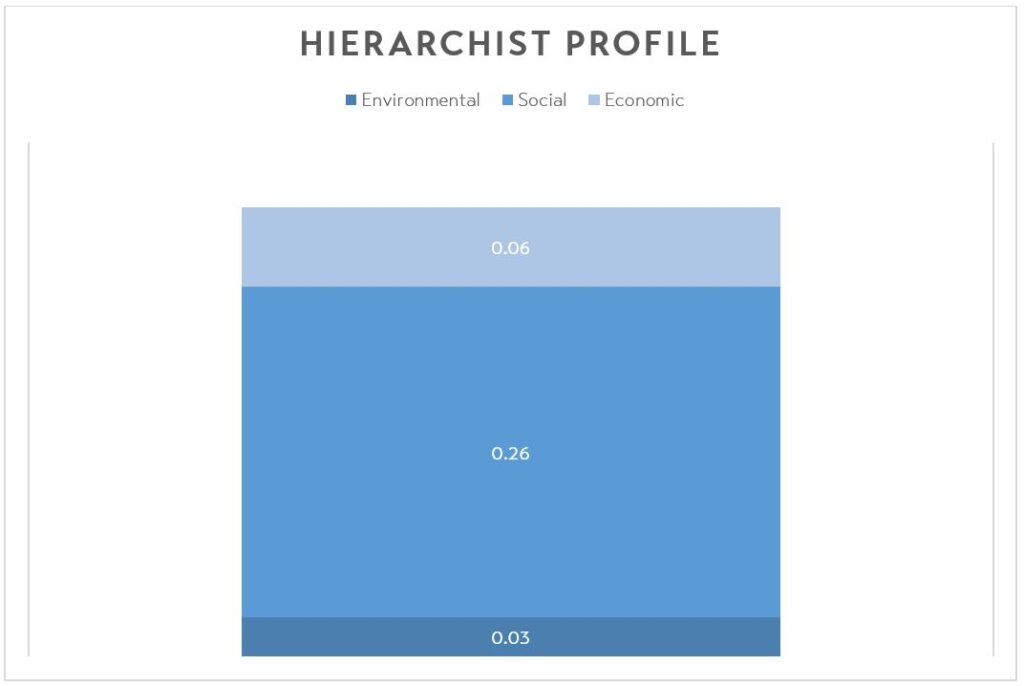
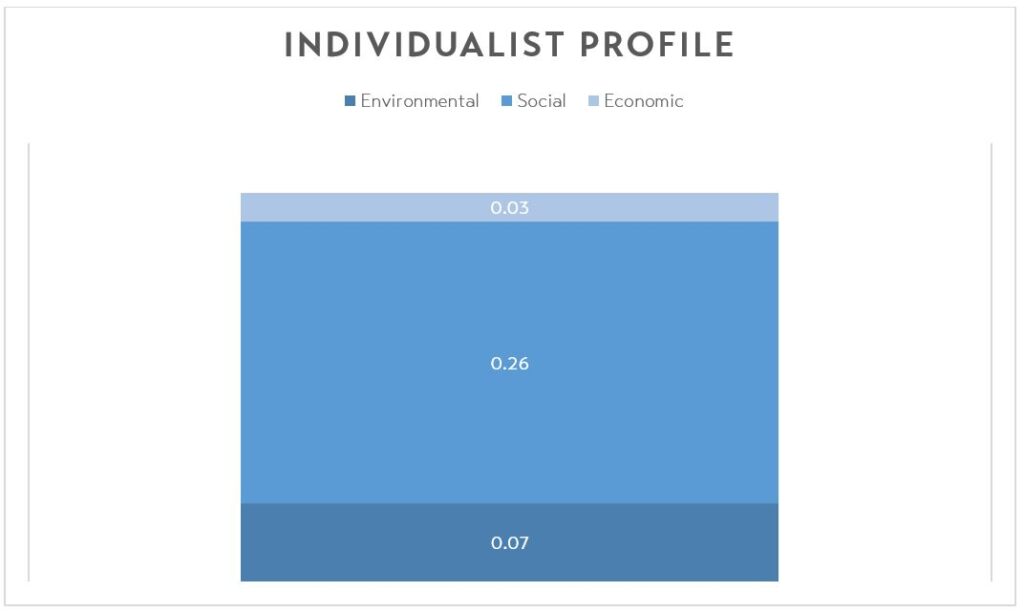
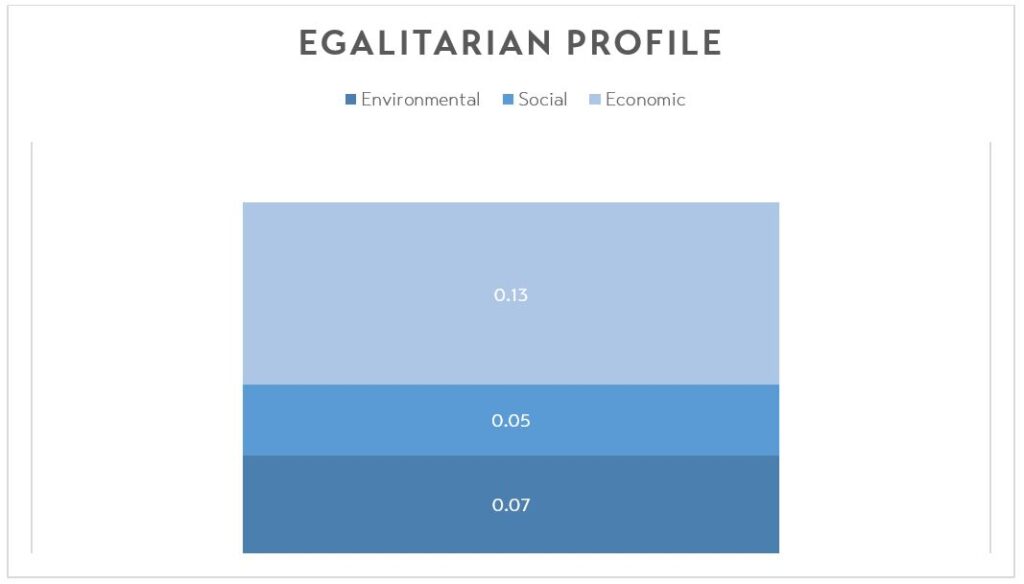
These weighted scores pose the potential for Wildcat Transit or other organizations to see which variables can directly affect their scores, and where prioritization may need to be placed in order to reach the most efficient levels of sustainability. The results of my project show that overall, sustainability is high within Wildcat Transit. However, for sustainability to continue to increase, the organization should start placing more focus into the social side of the operation. This can include reaching out to users to hear their comments/concerns, and then adapt the system or vehicles accordingly to accommodate those concerns. The results from the cultural theory analysis confirm this with the egalitarian profile, showing that weight placed into the social indicator will dramatically increase the social sustainability.
Continuing to pursue this research path in the future has the potential to expand the distribution as well as the model to be able to accommodate larger transportation organizations as well as additional vehicle fuel types.
How Hoyle Tanner Can Help
Our transportation services include formulating innovative design solutions that address regulatory constraints and functional requirements. Our roadway engineers account for future traffic and incorporate sustainable transportation infrastructure into projects focused on solving safety concerns, vehicular congestion, and environmental issues. We also have a sustainability framework you can read about here.
*It’s Hoyle Tanner’s 50th anniversary this year! Keep an eye on our Facebook, LinkedIn, and Twitter feeds for articles and anniversary news!


