What it is
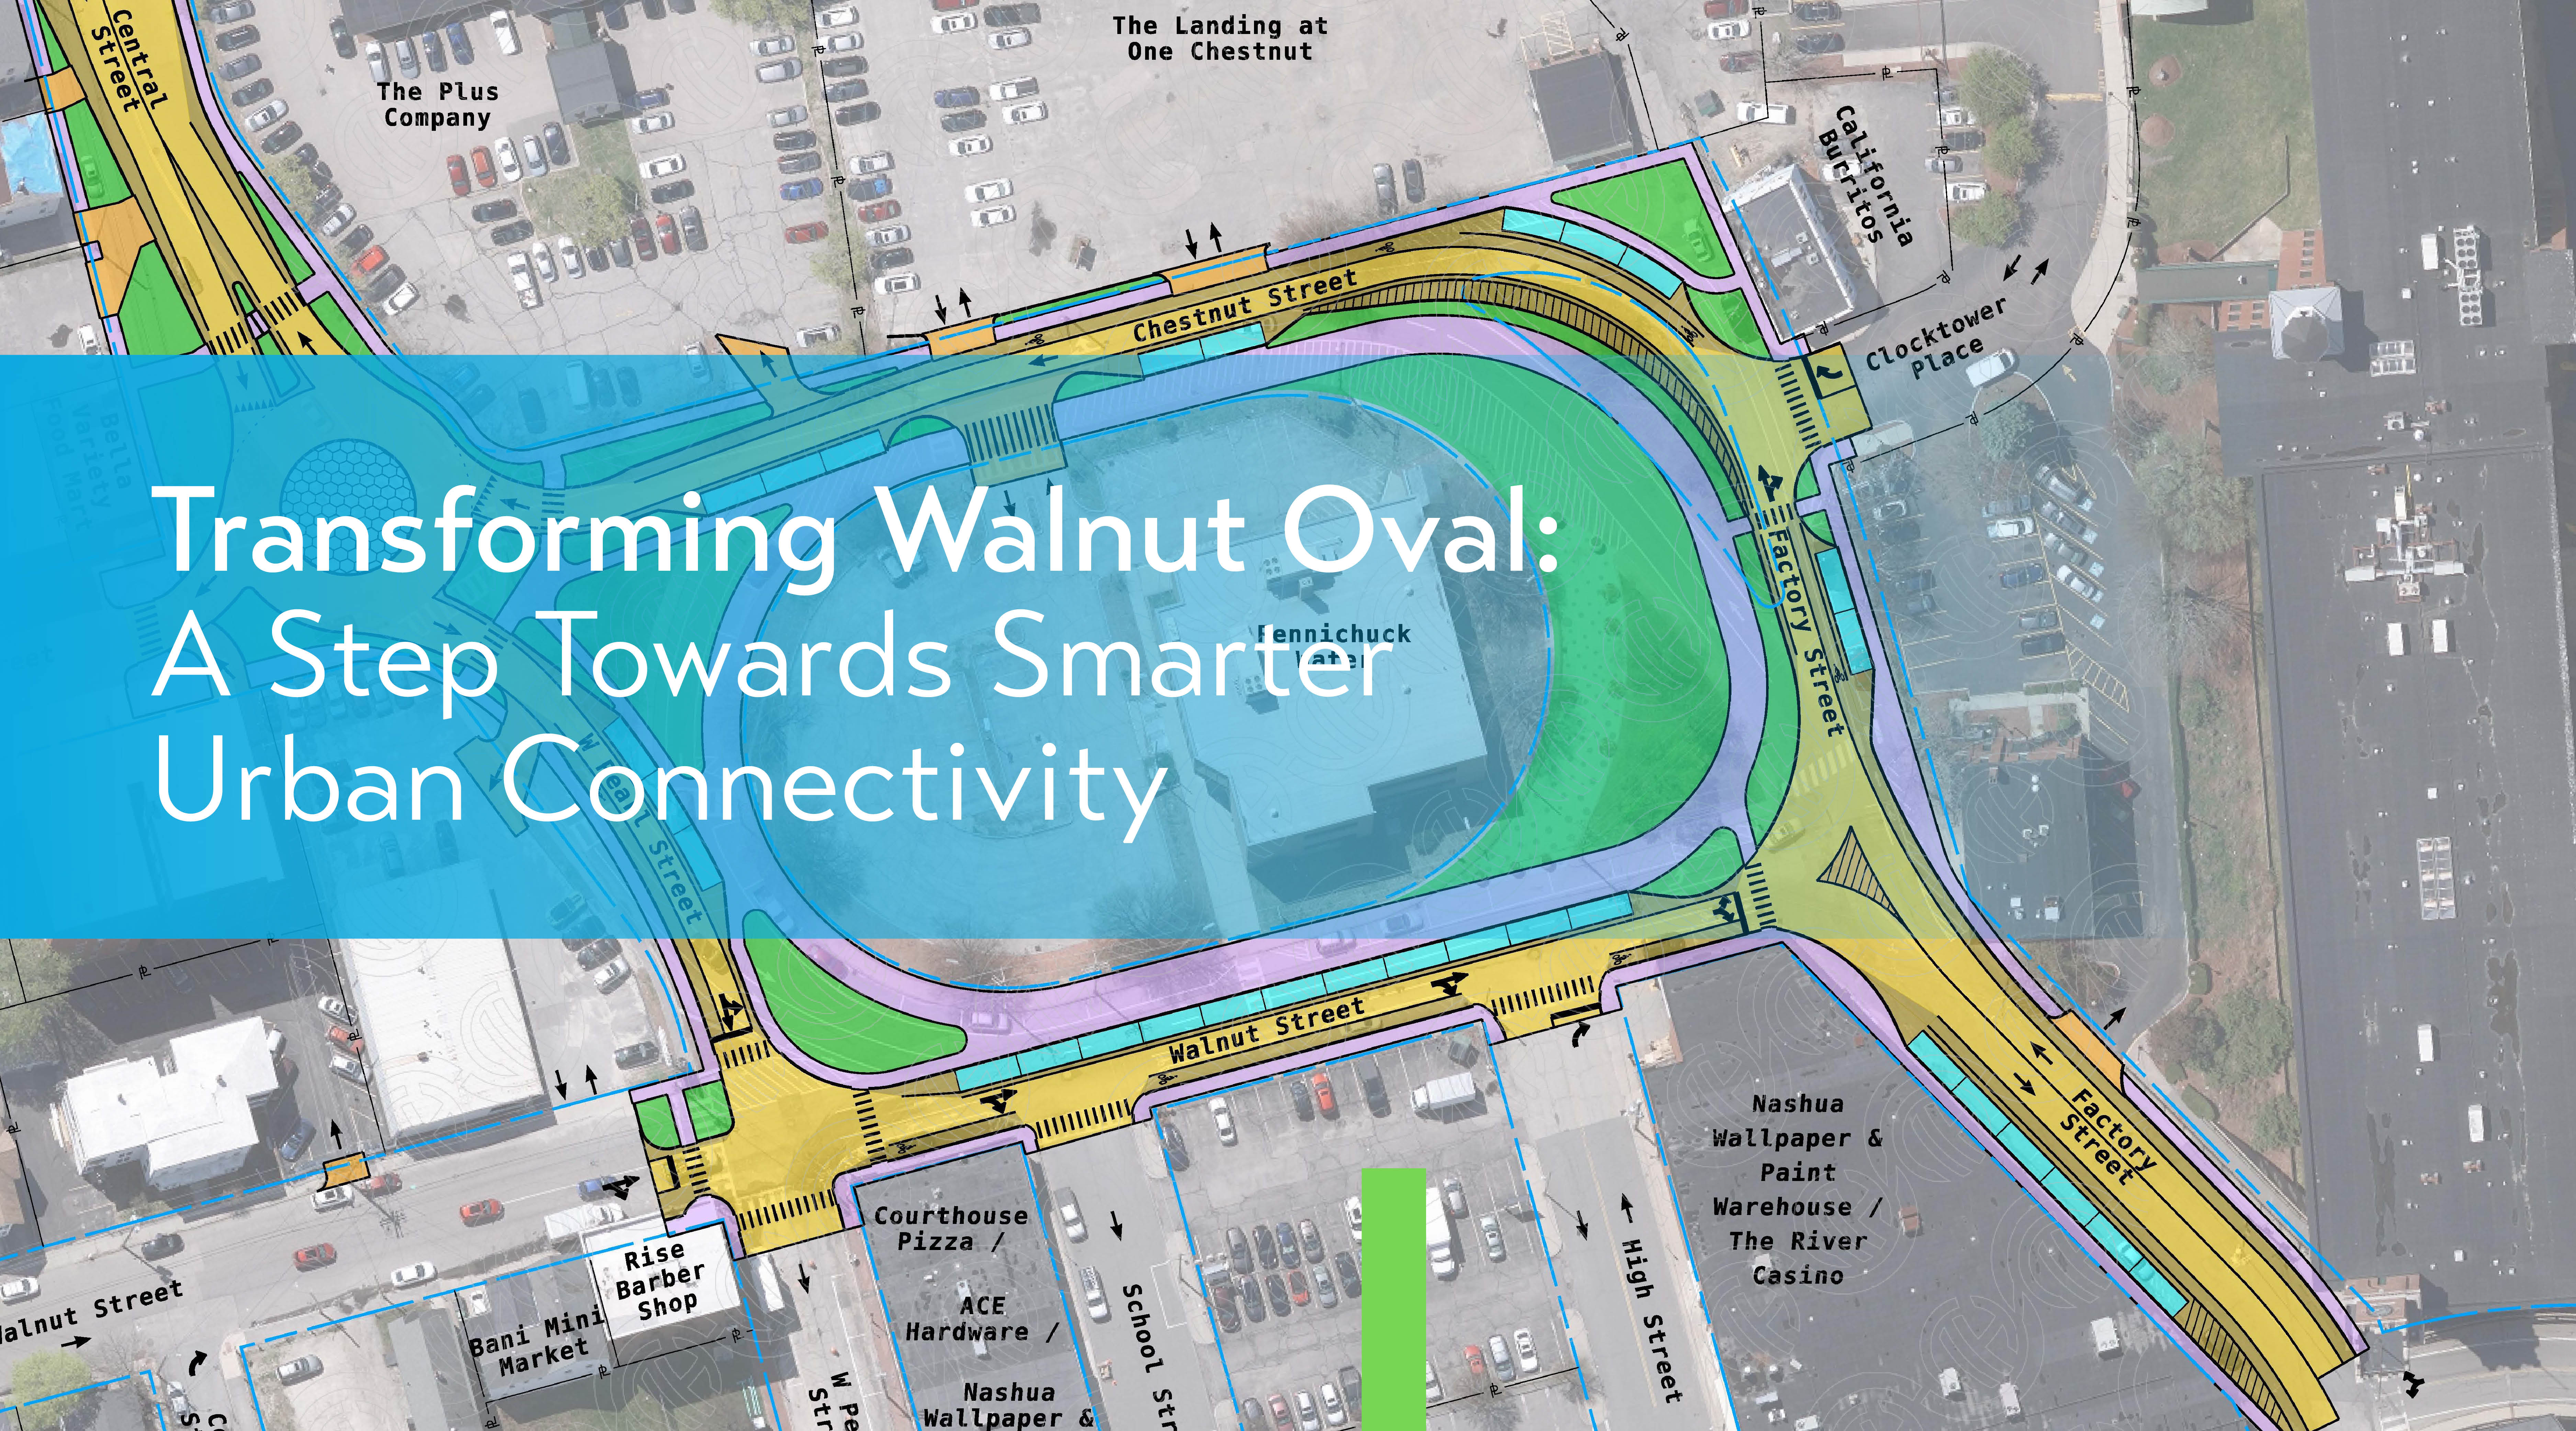
Traffic modeling takes raw data (in the form of traffic counts and speed data) and builds a visual representation. This visual representation allows us to see how things interact with each other, which can be as simple as a stop-controlled intersection or as complicated as an entire city grid. The modeling allows us to look at how intersections perform in terms of level of service, traffic delay, and capacity utilized among other metrics.
Traffic modeling doesn’t just show how cars move in a straight line on a road. Instead, the modeling shows how traffic might back up at an intersection based on how much green (light) time each direction of traffic is given, how side roads are affected by long lines of vehicles, and what is happening at turn lanes. We also include pedestrians when there’s significant data for them; at small, rural intersections, there is not enough demand to show them in the model.
The level of service is the key metric for analyzing how well a signal functions. Level of service is categorized by five letter grades (A through F), but it’s really just an incremental delay in seconds. For example, if the average driver is stuck at a traffic light for less than 10 seconds, that’s level of service A. If it’s over 10 but less than 20, that’s level of service B, and so on. So really, the level of service is just a way to say this is the range of delay that the average person gets at this intersection. It’s key that it’s the average driver; so the first person who pulls up to a red light is likely going to be sitting there for more of the full signal cycle, but someone that arrives on green had a zero second delay – that’s why it’s key to measure the average.
Why it’s useful
I’ve been using the modeling software since I started here in 2013. It was pretty basic for the first few years, really just using it to model temporary signals; like if we had to go to a one-lane work zone with alternating directions of traffic, we’d use a temporary signal for that and need to model it to make sure the queues didn’t cause any big problems. In terms of how traffic modeling differs from pure calculations, it really has to do with its scale. You know, you can input some parameters into the software, and it runs all the iterations you need and can simulate random traffic patterns that a calculation wouldn’t be able to do. It also helps give you a visual representation of it. I could do a calculation that says, okay there’s a 300-foot queue here, but then when we put it in the modeling software, we can see that the queue is actually blocking a side road or spilling into the next traffic signal.
The flexibility to play around in the software is also significant. With a calculation, if you want to change something, you more or less have to restart the calc; but in the model, you can toggle a switch and it just completely changed your model – and you can change it back if you need to.

Our standard traffic modeling program is Synchro which is the static model, and then we also have SimTraffic which creates a video simulation of cars moving through the model. The video is the simulation of when the system is populated – that’s what uses the random traffic patterns, which is helpful because there is no calculation for random traffic patterns. You need to have the computer algorithm that best approximates random traffic driving patterns. With that simulation, you get to see how signals interact with each other; so you have one signal, and then you have another one 300 feet away; they might not be coordinated, but they will still influence the traffic patterns at each other, and it’s crucial to see what sort of problems they may cause.
What the challenges are
There are only minor downsides to traffic modeling software. There are so many different parameters in the programs that you might get a totally different result if you overlook one that’s buried deep in the dialogue boxes. In terms of reporting, there are also several different analysis methods you can get from the program. The simulation doesn’t change, but I can have the same traffic volumes and signal timing and still get three slightly different results based on the analysis method. There’s no significant difference, but depending on what the client or agency expects when they review it, it can impact the program’s options.
A good example is New Hampshire Department of Transportation (NHDOT) has published preferences for their report formats, but many clients do not have preferences, and so the lack of standardization can be a challenge.
Where it’s headed in the future
In the future, we will be using traffic modeling software more often. The developers of the traffic modeling software are continuously working on and releasing updates for the programs. We as designers are constantly trying to come up with new ways for traffic signals to be safer or to handle higher capacity. Sometimes, the software doesn’t have the availability to model those correctly because it’s a new innovation that hasn’t made it back into the software yet. So sometimes these updates are just the software catching up to what’s actually being in done in the field.
I expect there will also be some improved bicycle and pedestrian modeling capabilities. Right now, we can say there’s X number of bicycles per hour, but I envision software developers will be adding bicycle signal heads next to traffic lights because that’s an up-and-coming technology. It’s been tested in a couple of states already, and it could become an important part of traffic modeling software updates in the near future.
I’m part of a team that prepares traffic modeling projects for municipalities and state agencies across New England. Reach out to me with traffic questions or to learn more about NHITE.


